Conservation Data Visualization
Breeding Bird Survey Animations
Watch North American bird populations change over time (1966-2015): passerines and non-passerines. Data from the North American Breeding Bird Survey. Code available here.
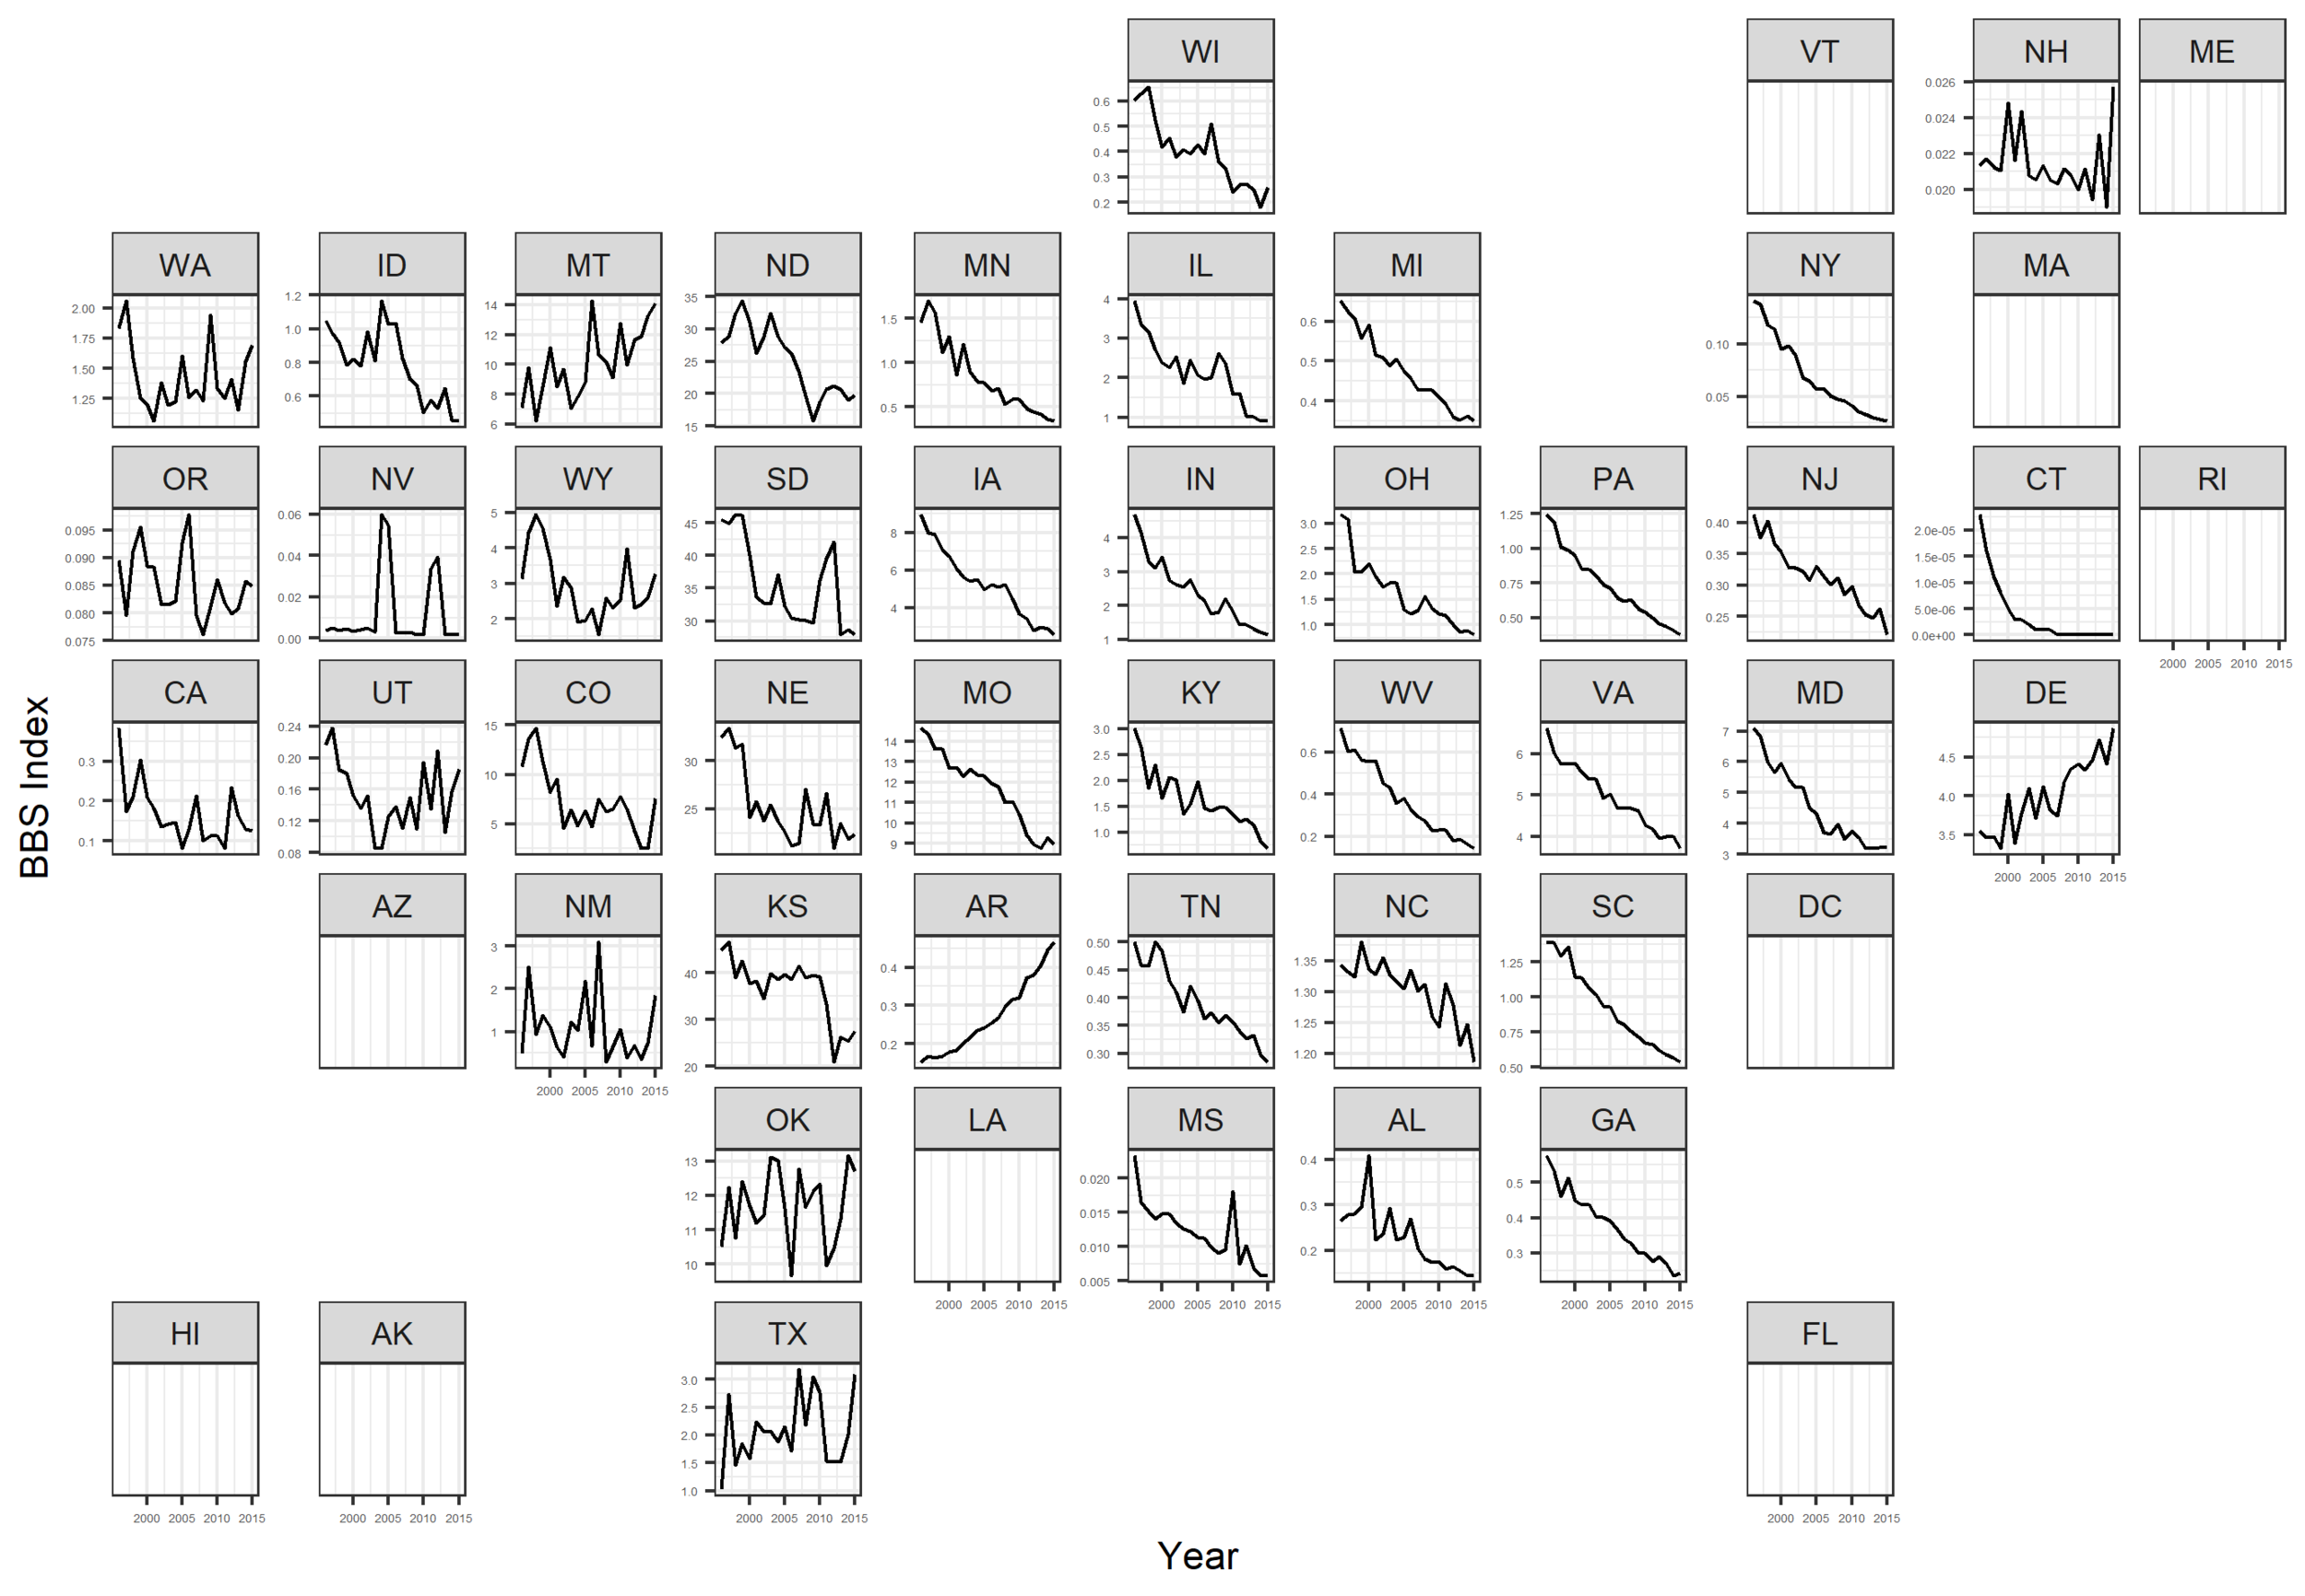
Breeding Bird Survey Graph-Maps
Visualize state-level bird population trends in all 50 states based on indices with the geofacet R package. Data from the North American Breeding Bird Survey. Code available here.
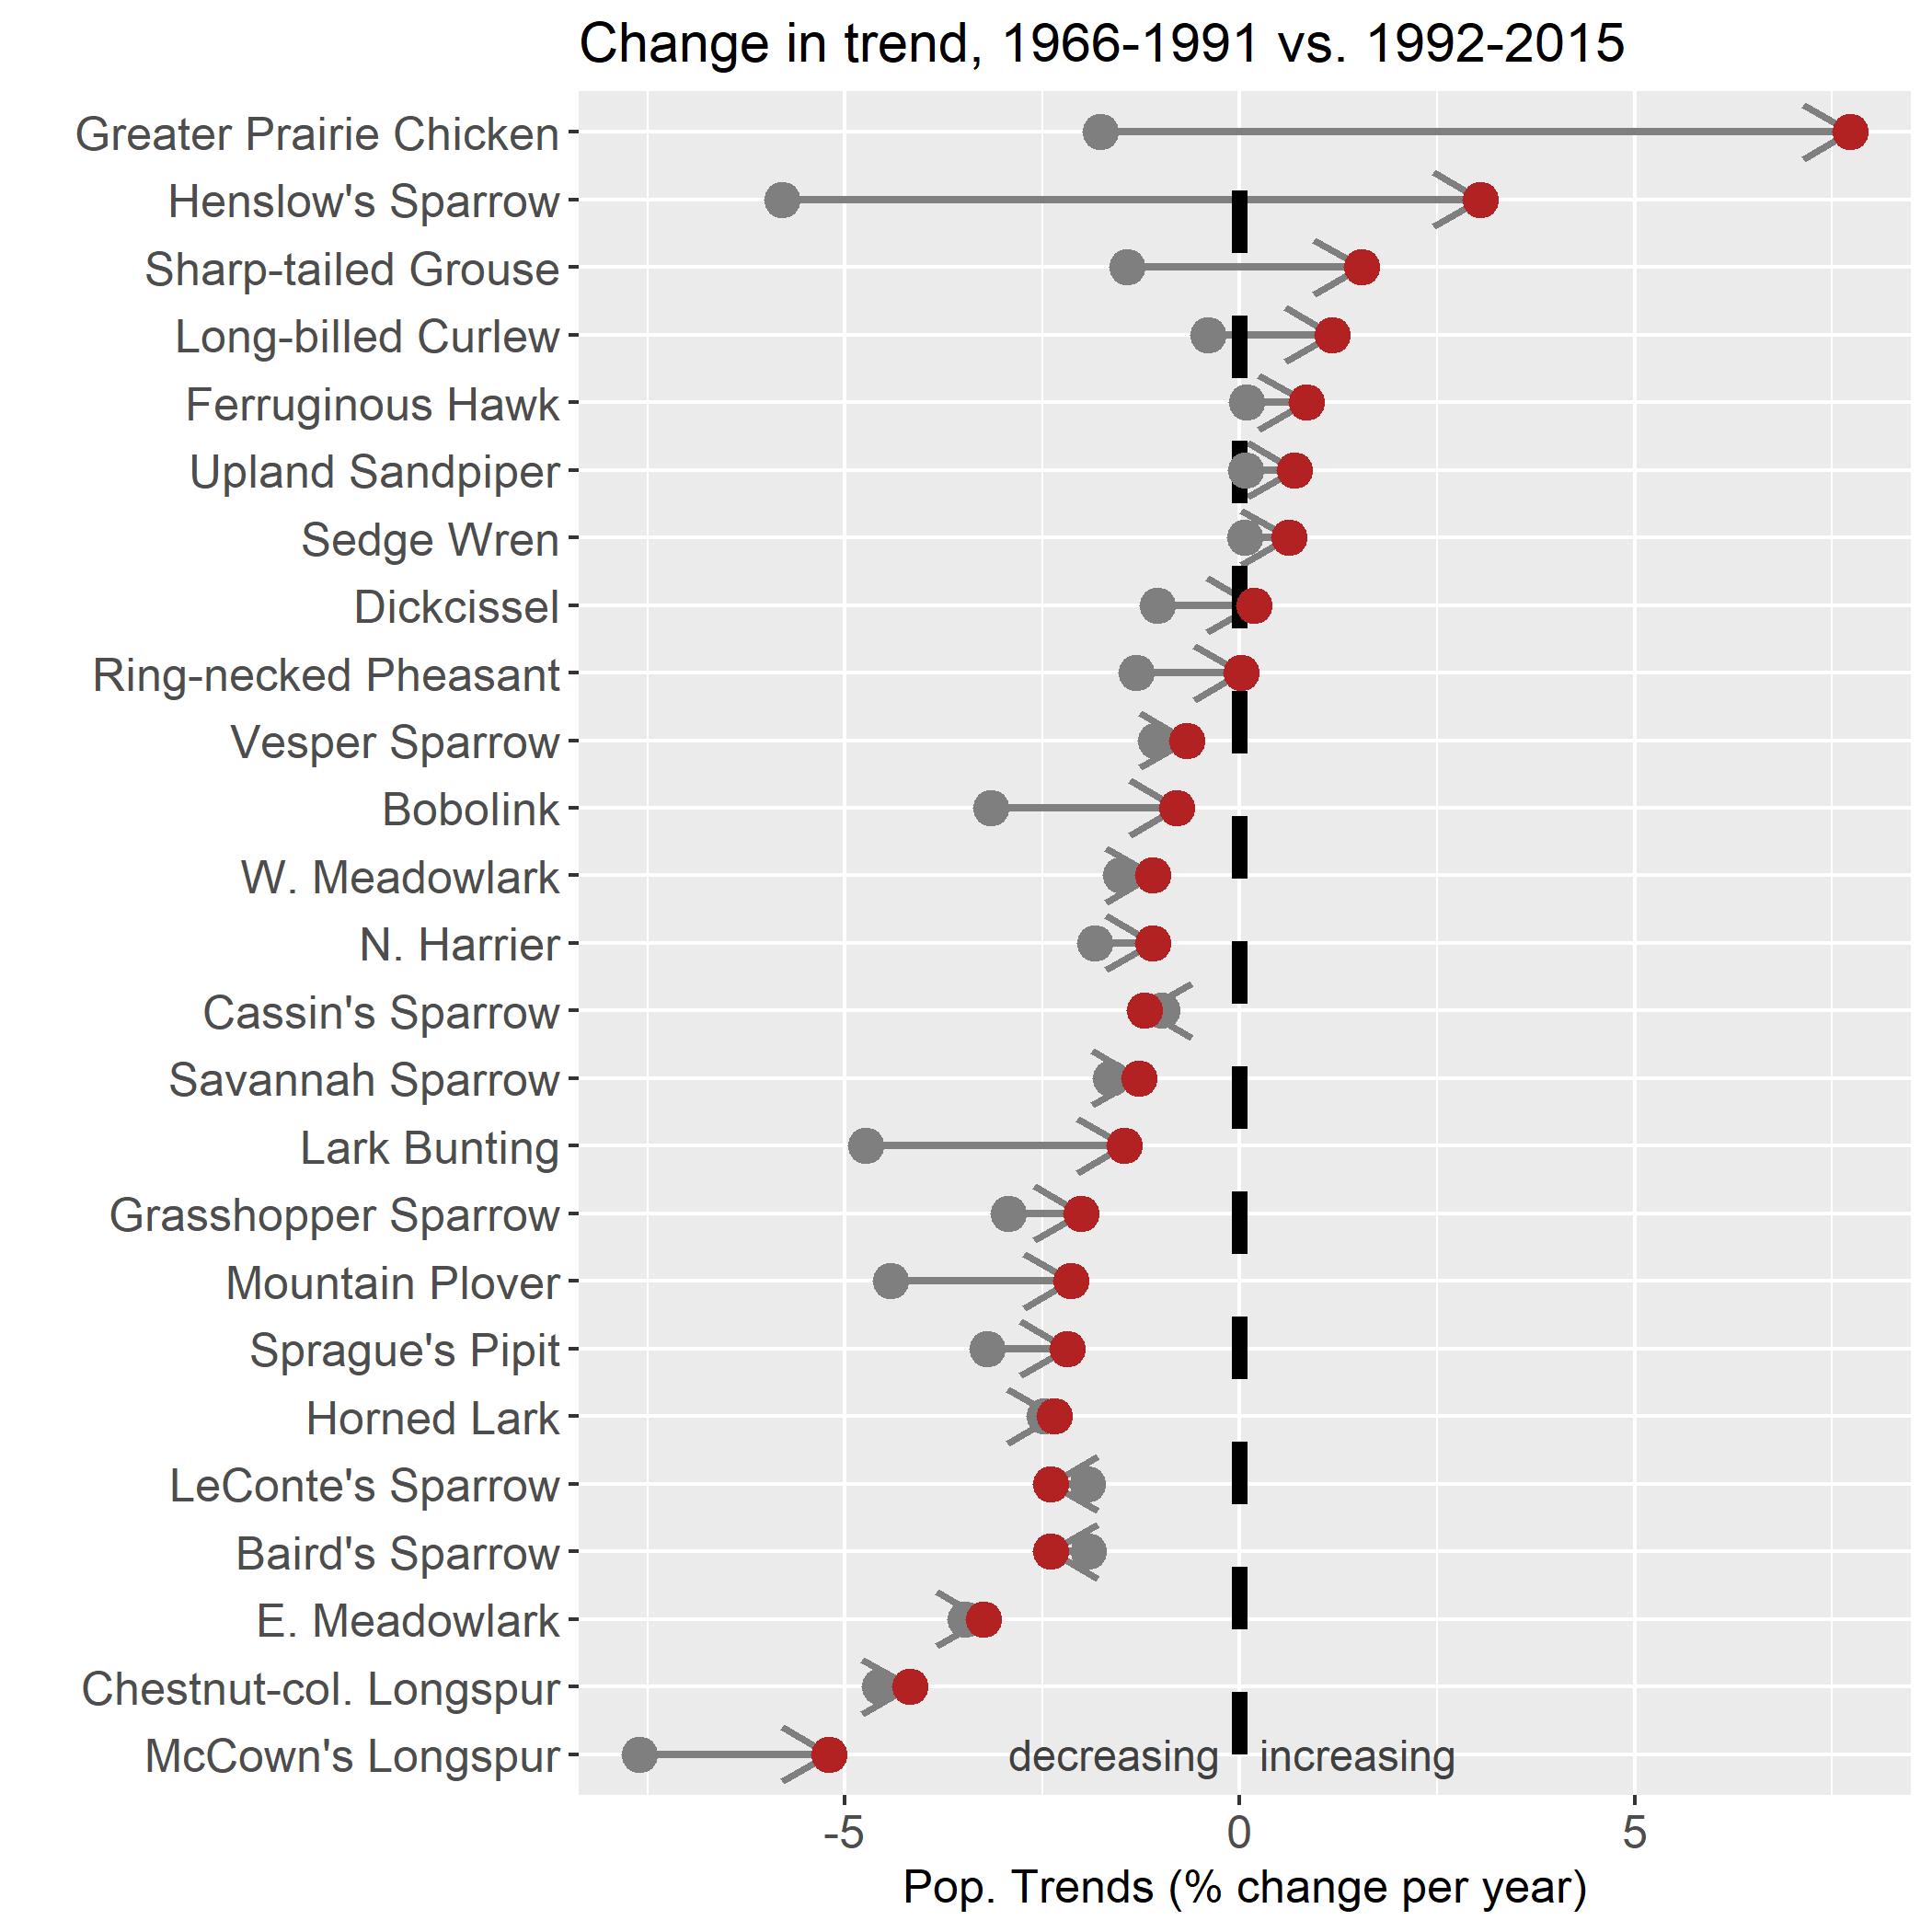
Change in population trends over time (Conservogram)
Show changes in population trends between two time periods. Who is declining/increasing, doing worse/better? These data from the Breeding Bird Survey, but can be adapted to others. Code here.