Conservogram
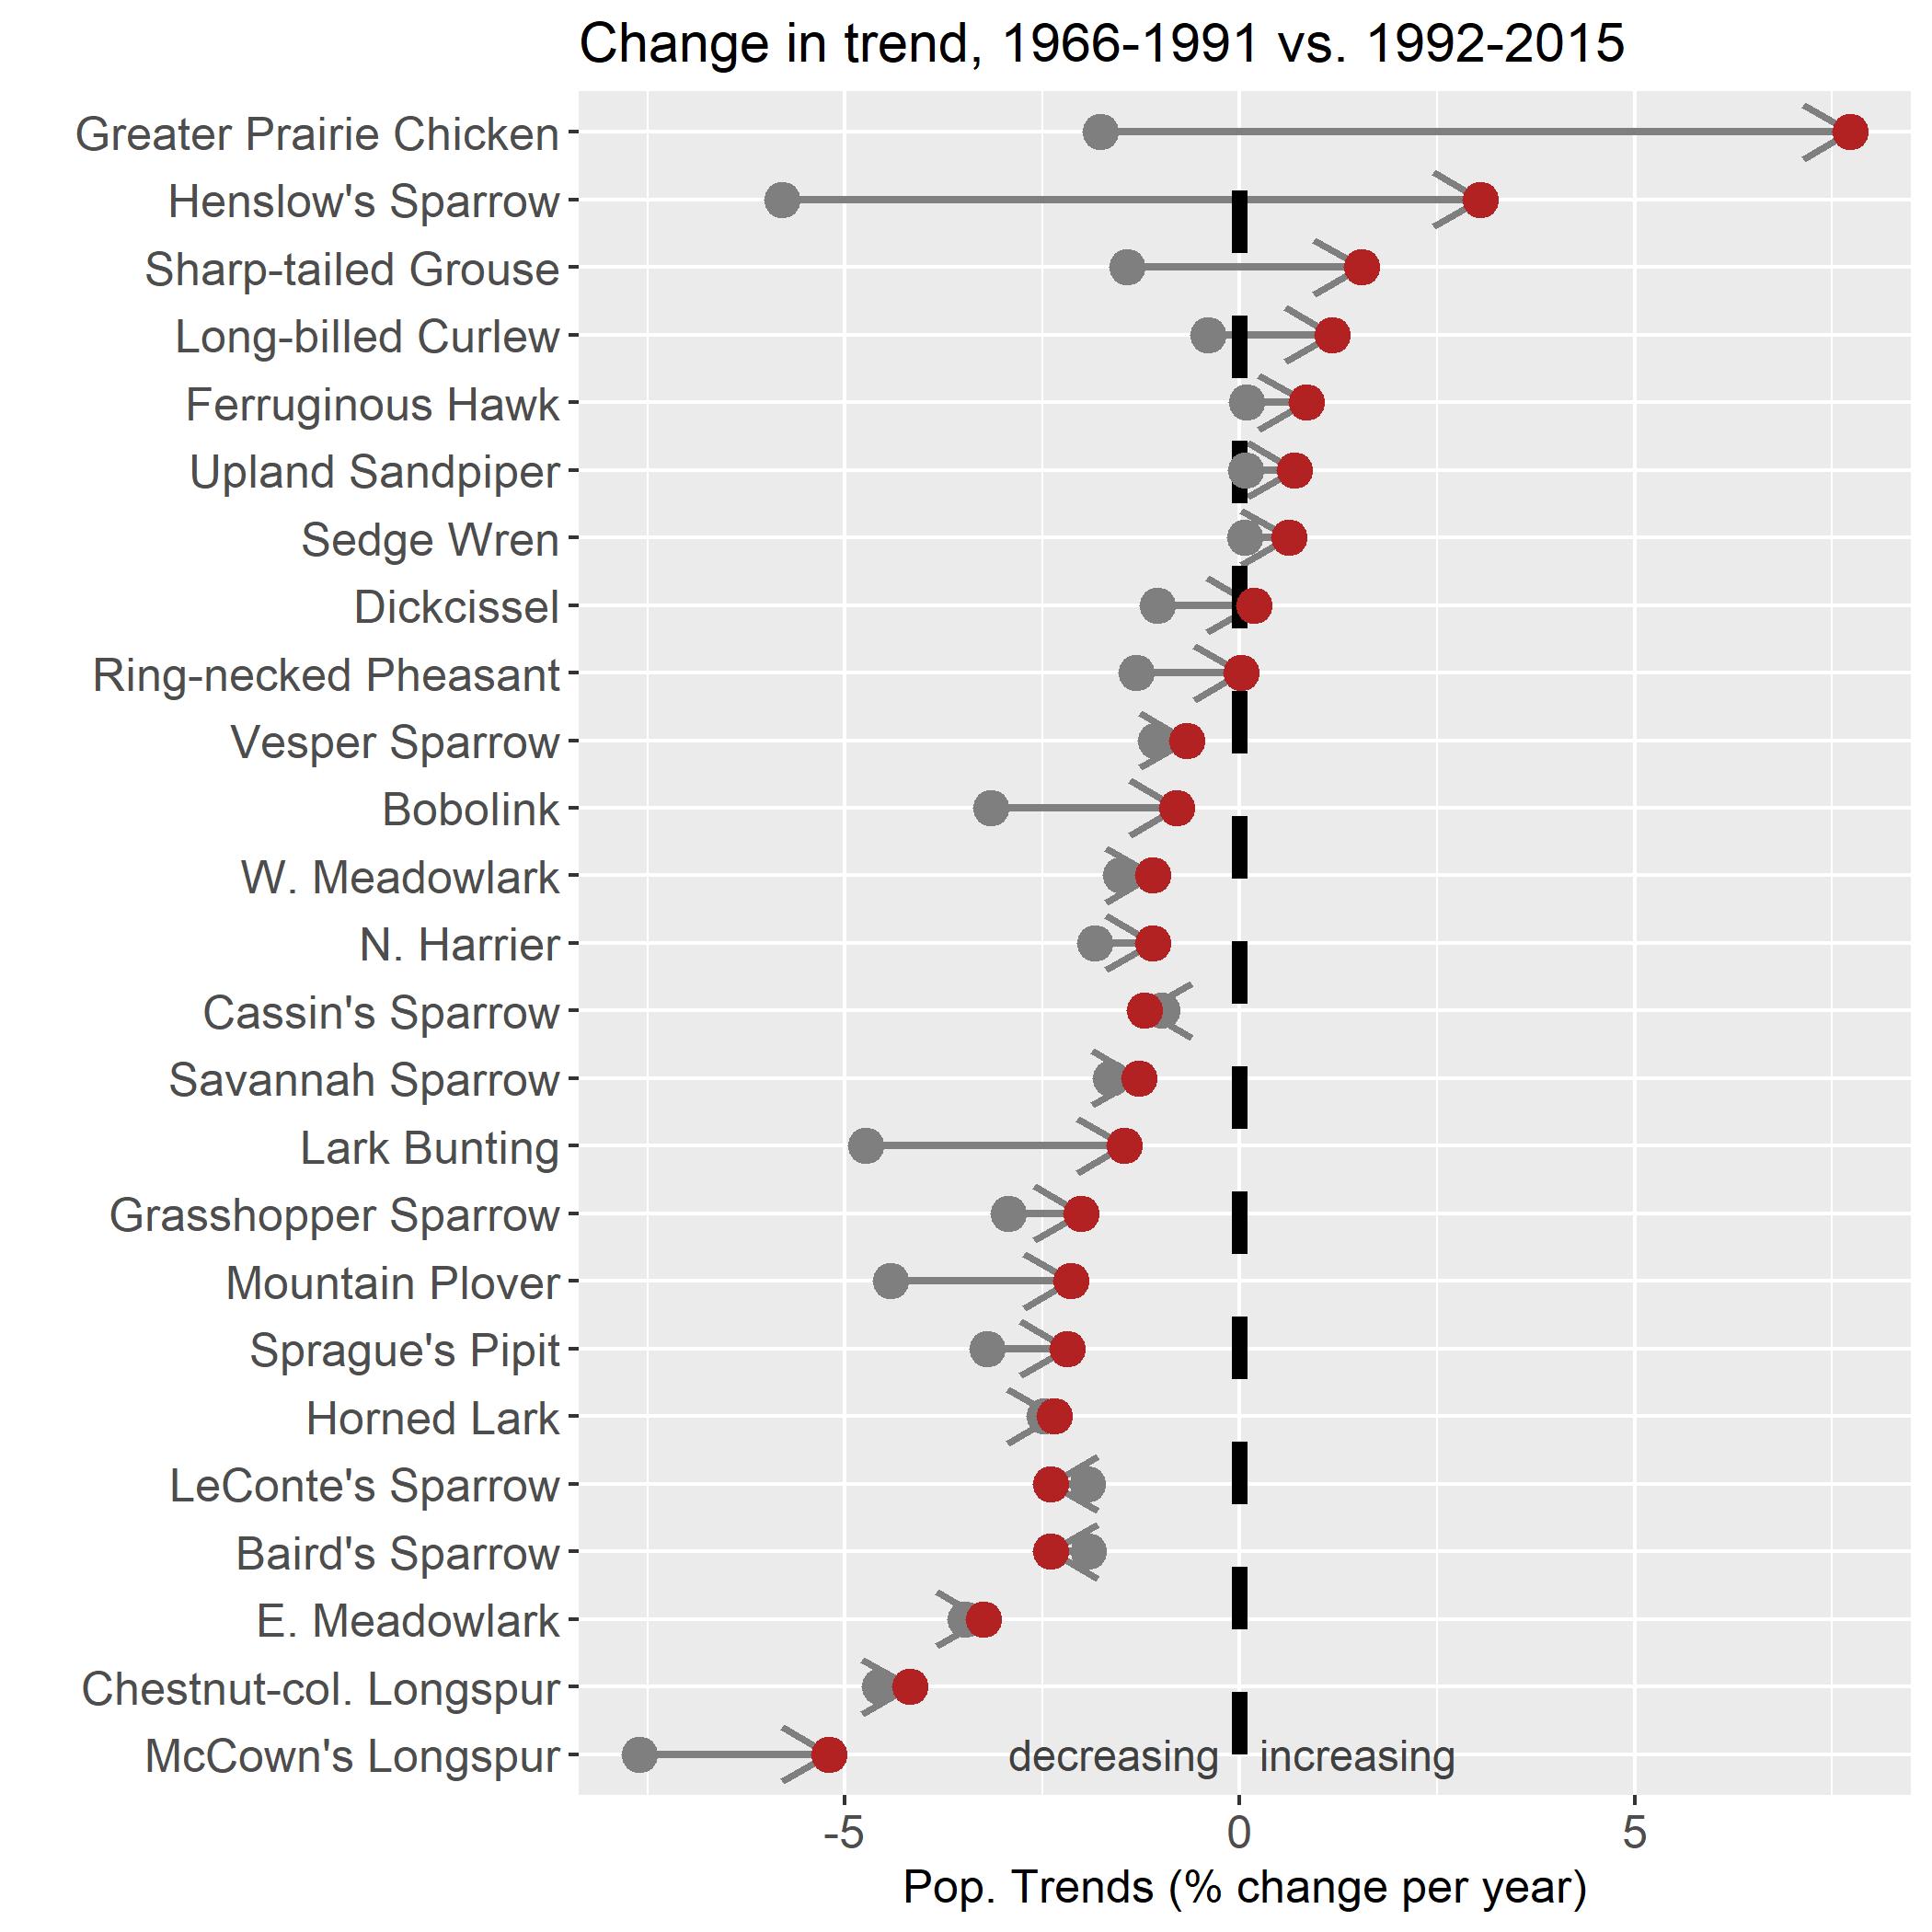
A dot plot to visualize temporal changes in population trends for species of conservation concern.
This example is of grassland birds in North America, but you can customize with any ‘historical’ and ‘recent’ trend info. Data in this case came from the USGS’s custom trend generator based on a Bayesian hierarchical model of Breeding Bird Survey data.
Code to customize for other applications is available here: https://github.com/mikeallen-eco/conservogram